Infrastructure as Code for Grafana Dashboards
TL;DR: #
- A dashboard is, in essence, an array of (title, query) pairs: you can get pretty close to that essence. The styling of the panels within that dashboard is typically common!
- Use the sample code below to programmatically create Grafana dashboards and alerts.
- Use your company's common programming language to define dashboards for great developer ergonomics and lower barriers to entry.
- Grafana dashboard panels play an upside down game of Tetris!
This post came about from some work I and others did at Resolve.ai; check them out for your agentic on-call needs! I'm sharing it with you with their kind permission.
Checking dashboards into git gets you all the usual "infrastructure as code"
advantages: for loops, variables, version control, consistency. The essence of a
dashboard is the queries that power the visualizations. More often than not,
the visualizations themselves are similar across many queries. Writing the dashboards as code lets you
focus on the essence—the queries—and re-use the styling. This post does
that with Grafana and TypeScript.
I chose to use TypeScript to define the dashboards, so as to embed the dashboards within a language and tooling ecosystem we already know well. (Others may choose to use the Terraform provider or JSONnet). TypeScript's type system and language server are a real advantage in working with Grafana's APIs, because there are exist good types for the surface area.
Background: Grafana Dashboard Structure #
Grafana's Foundation SDK has types for many Grafana dashboard concepts as well as examples. The JSON model for dashboards is documented as part of Grafana's API documentation. A Grafana dashboard has 3 main components:
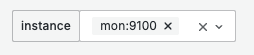
- Variables. These appear at the top and can be used to drill down to specific instances of your infrastructure. They're used within the individual PromQL queries, and Grafana does a great job of letting you specify a metric to grab the possible values.
-
Rows. These visually separate groups of metrics.
-
Panels. These are the visualizations you place in your dashboard. The Grafana grid is composed of 24 columns, and each "height" unit represents 30 pixels. The grid has negative gravity, which means that a panel slides upwards to empty space, like an upside down game of Tetris. If you want three charts per row, you use a width of 8, and if you want two, use a width of 12. Using "4! = 24" as a basis gives the chart lots of divisors for layout options! We've found that if you just specify a height and width in your panels, Grafana lays them out in order nicely enough.

The panels are where all the action is, and there are many, many panel types. This folder has many panel types, including the very popular "timeseries", "text", "piechart", and so forth. For the most part, Grafana's JSON system has sensible defaults, so you don't need to specify all possible properties. This is a big win of using the JS bindings over checking in the "expanded" JSON directly. (We've found that the Cloudwatch panel is pretty picky and doesn't work if you don't specify nearly everything.)
Generating your dashboard #
Now that we sort of understand's Grafana's nouns, we can build out a dashboard in code.
It's very likely that you want a lot of panels
of all the same type, so you define something like
addTimeseriesChart({title, promQL}) and invoke it many times.
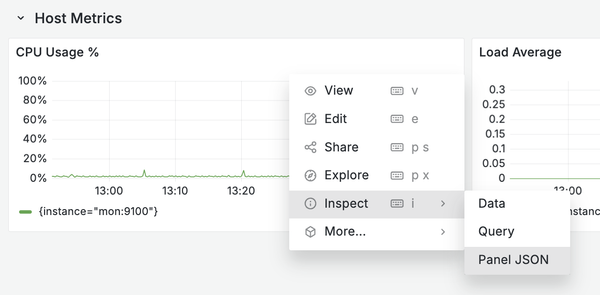
If you need to do advanced things, you can do one manually in the UI, and then find the "Inspect…Panel Json" action on every Grafana Panel to dig in.
Most of your dashboards will look something like this. The rest is boilerplate at the per-dashboard and overall layers:
addTimeseriesChart(
  "CPU Usage %",
  `100 - (avg by (instance) (irate(node_cpu_seconds_total{mode="idle",instance=~"$instance"}[5m])) * 100)`,
  {
    panelCustomization: (panel) => panel.unit("percent").max(100).min(0),
  }
);
We can now look at the end to end example, annotated slightly. You’ll need a Grafana bearer token to run this against your instance.
Here are the key files you'll need:
package.json- Dependencies and npm scriptstsconfig.json- TypeScript configurationgrafana-dashboard.ts- The main script (shown below)- (optional)
eslint.config.mjs- ESLint setup for TypeScript
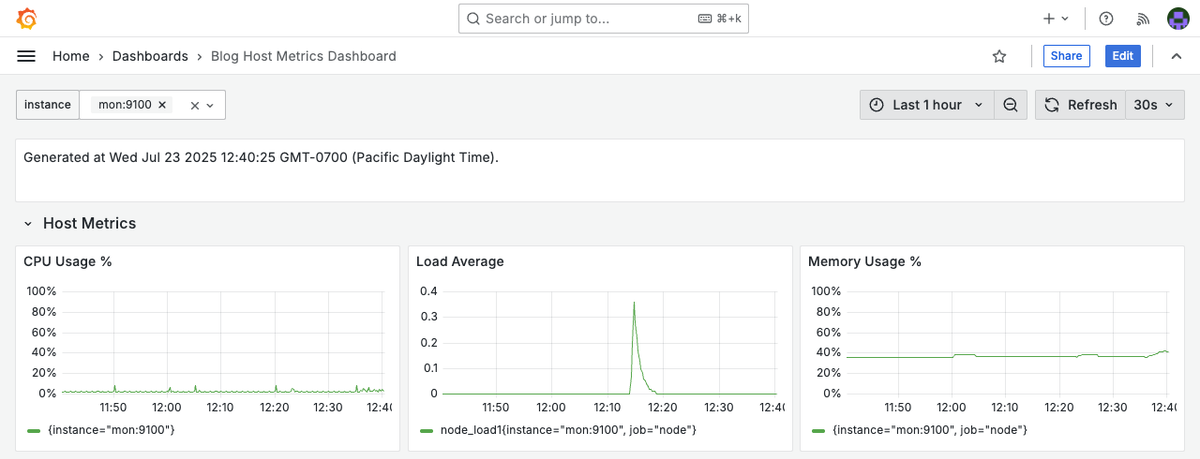
This is the dashboard it generates:
Here's the TypeScript code that generates this dashboard:
// To run:
//  npm install
//  GRAFANA_BEARER_TOKEN=XXX GRAFANA_URL=https://XXX.grafana.net/ npx tsx grafana-dashboard.ts

import {
  DashboardBuilder,
  DashboardCursorSync,
  QueryVariableBuilder,
  RowBuilder,
} from "@grafana/grafana-foundation-sdk/dashboard";
import {
  PanelBuilder as TextPanelBuilder,
  TextMode,
} from "@grafana/grafana-foundation-sdk/text";
import { DataqueryBuilder } from "@grafana/grafana-foundation-sdk/prometheus";
import { PanelBuilder as TimeseriesBuilder } from "@grafana/grafana-foundation-sdk/timeseries";

const TOKEN = process.env.GRAFANA_BEARER_TOKEN;
const GRAFANA_URL = process.env.GRAFANA_URL;

// This is the definition of the dashboard!
function makeBlogDashboard() {
  // Declare the name and define a unique id.
  const dash = new DashboardBuilder("Blog Host Metrics Dashboard");
  dash
    .uid("blog-host-dashboard")
    .tags(["generated", "blog"])
    .refresh("30s")
    .time({ from: "now-1h", to: "now" })
    .tooltip(DashboardCursorSync.Crosshair)
    .timezone("browser");

  // Helper function for adding charts.
  const addTimeseriesChart = makeAddTimeseriesChart(dash);

  // Variable definitions. Grafana uses metric queries to populate the possible
  // values, and the variable queries can depend on each other.
  dash
    .withVariable(
      new QueryVariableBuilder("instance")
        .query("label_values(up, instance)")
        .current({ text: "All", value: "$__all" })
        .multi(true),
    );

  // Example of a text panel with generation timestamp.
  dash.withPanel(
    new TextPanelBuilder()
      .title("")
      .content(
        `Generated at ${new Date()}.`,
      )
      .mode(TextMode.Markdown)
      // Full width.
      .gridPos({ x: 0, y: 0, w: 24, h: 2 }),
  );

  // Let's give the row a title!
  dash.withRow(new RowBuilder("Host Metrics"));

  // Add basic host metrics charts
  addTimeseriesChart(
    "CPU Usage %",
    `100 - (avg by (instance) (irate(node_cpu_seconds_total{mode="idle",instance=~"$instance"}[5m])) * 100)`,
    {
      panelCustomization: (panel) => panel.unit("percent").max(100).min(0),
    },
  );

  addTimeseriesChart(
    "Load Average",
    `node_load1{instance=~"$instance"}`,
    {
      panelCustomization: (panel) => panel.unit("short"),
    },
  );

  addTimeseriesChart(
    "Memory Usage %",
    `(1 - (node_memory_MemAvailable_bytes{instance=~"$instance"} / node_memory_MemTotal_bytes{instance=~"$instance"})) * 100`,
    {
      panelCustomization: (panel) => panel.unit("percent").max(100).min(0),
    },
  );

  return dash;
}

// Helper method to create "addTimeseriesChart" methods for your dashboard.
function makeAddTimeseriesChart(dash: DashboardBuilder) {
  const builders = {
    buildPanel: () =>
      new TimeseriesBuilder().gridPos({ x: 0, y: 0, w: 8, h: 6 }),
    // You might need to specify a default datasource, like so:
    // new DataqueryBuilder().datasource({ type: "prometheus", uid: "prometheus-uid" })
    buildQueryTarget: () => new DataqueryBuilder(),
  };
  return makeAddChart<TimeseriesBuilder>(dash, builders);
}

// Helper method for the helper methods. This facilitates using panel types.
function makeAddChart<T extends TimeseriesBuilder>(
  dash: DashboardBuilder,
  builders: { buildPanel: () => T; buildQueryTarget: () => DataqueryBuilder },
) {
  return function addChart(
    title: string,
    query: string,
    {
      panelCustomization,
      queryCustomization,
    }: {
      panelCustomization?: (panel: T) => T;
      queryCustomization?: (dataQuery: DataqueryBuilder) => DataqueryBuilder;
    } = {},
  ) {
    const panel = builders.buildPanel().title(title);
    const queryTarget = builders.buildQueryTarget().expr(query);

    // Apply query customization if provided
    if (queryCustomization) {
      queryCustomization(queryTarget);
    }

    // Apply panel customization if provided
    if (panelCustomization) {
      panelCustomization(panel);
    }

    // Attach the customized query target to the panel
    panel.withTarget(queryTarget);
    dash.withPanel(panel);
  };
}

/**
 * Invokes the Grafana API to create or update the given dashboard.
 */
async function createDashboard(dash: DashboardBuilder) {
  let version: number | undefined = undefined;
  const built = dash.build();
  // 1) Try to fetch existing dashboard to get its version:
  const getResponse = await fetch(
    `${GRAFANA_URL}api/dashboards/uid/${built.uid}`,
    {
      headers: {
        "Content-Type": "application/json",
        Authorization: `Bearer ${TOKEN}`,
      },
    },
  );
  // If response is OK, parse JSON and retrieve version:
  if (getResponse.ok) {
    const getData = await getResponse.json() as { dashboard: { version: number } };
    version = getData.dashboard.version;
    built.version = version;
  } else if (getResponse.status === 404) {
    // If the dashboard does not exist, set version to 0
    built.version = 0;
  } else {
    // Other non-200 responses are treated as errors:
    throw new Error(`Fetch GET failed with status: ${getResponse.status}`);
  }

  // 2) POST (create or overwrite) the dashboard:
  try {
    const postResponse = await fetch(`${GRAFANA_URL}api/dashboards/db`, {
      method: "POST",
      headers: {
        "Content-Type": "application/json",
        Authorization: `Bearer ${TOKEN}`,
      },
      body: JSON.stringify({
        dashboard: built,
        overwrite: true,
        message: "Automated update from blog post",
      }),
    });
    if (!postResponse.ok) {
      const errorText = await postResponse.text();
      throw new Error(
        `Fetch POST failed with status: ${postResponse.status}. Response: ${errorText}`,
      );
    }
    // Parse JSON for the returned info
    const data = await postResponse.json() as { uid: string };
    console.log("Dashboard updated successfully!");
    console.log("Dashboard URL:", `${GRAFANA_URL}d/${data.uid}`);
    return data;
  } catch (error) {
    console.error("Error posting dashboard:", error);
    throw error;
  }
}

async function main() {
  if (!TOKEN) {
    console.error(
      "Please provide a Grafana bearer token in the GRAFANA_BEARER_TOKEN environment variable.",
    );
    process.exit(1);
  }
  if (!GRAFANA_URL) {
    console.error(
      "Please provide the Grafana URL in the GRAFANA_URL environment variable.",
    );
    process.exit(1);
  }

  // Ensure URL ends with /
  const normalizedUrl = GRAFANA_URL.endsWith("/")
    ? GRAFANA_URL
    : GRAFANA_URL + "/";
  process.env.GRAFANA_URL = normalizedUrl;

  console.log("Creating dashboard...");
  await createDashboard(makeBlogDashboard());
}

// Run main function if this file is executed directly
if (import.meta.url === `file://${process.argv[1]}`) {
  await main();
}
Happy monitoring!
By the way... #
Coding agents are great at modifying the code above. Give your favorite (I'm partial to Sketch) agent the Grafana keys, and let it do its thing.